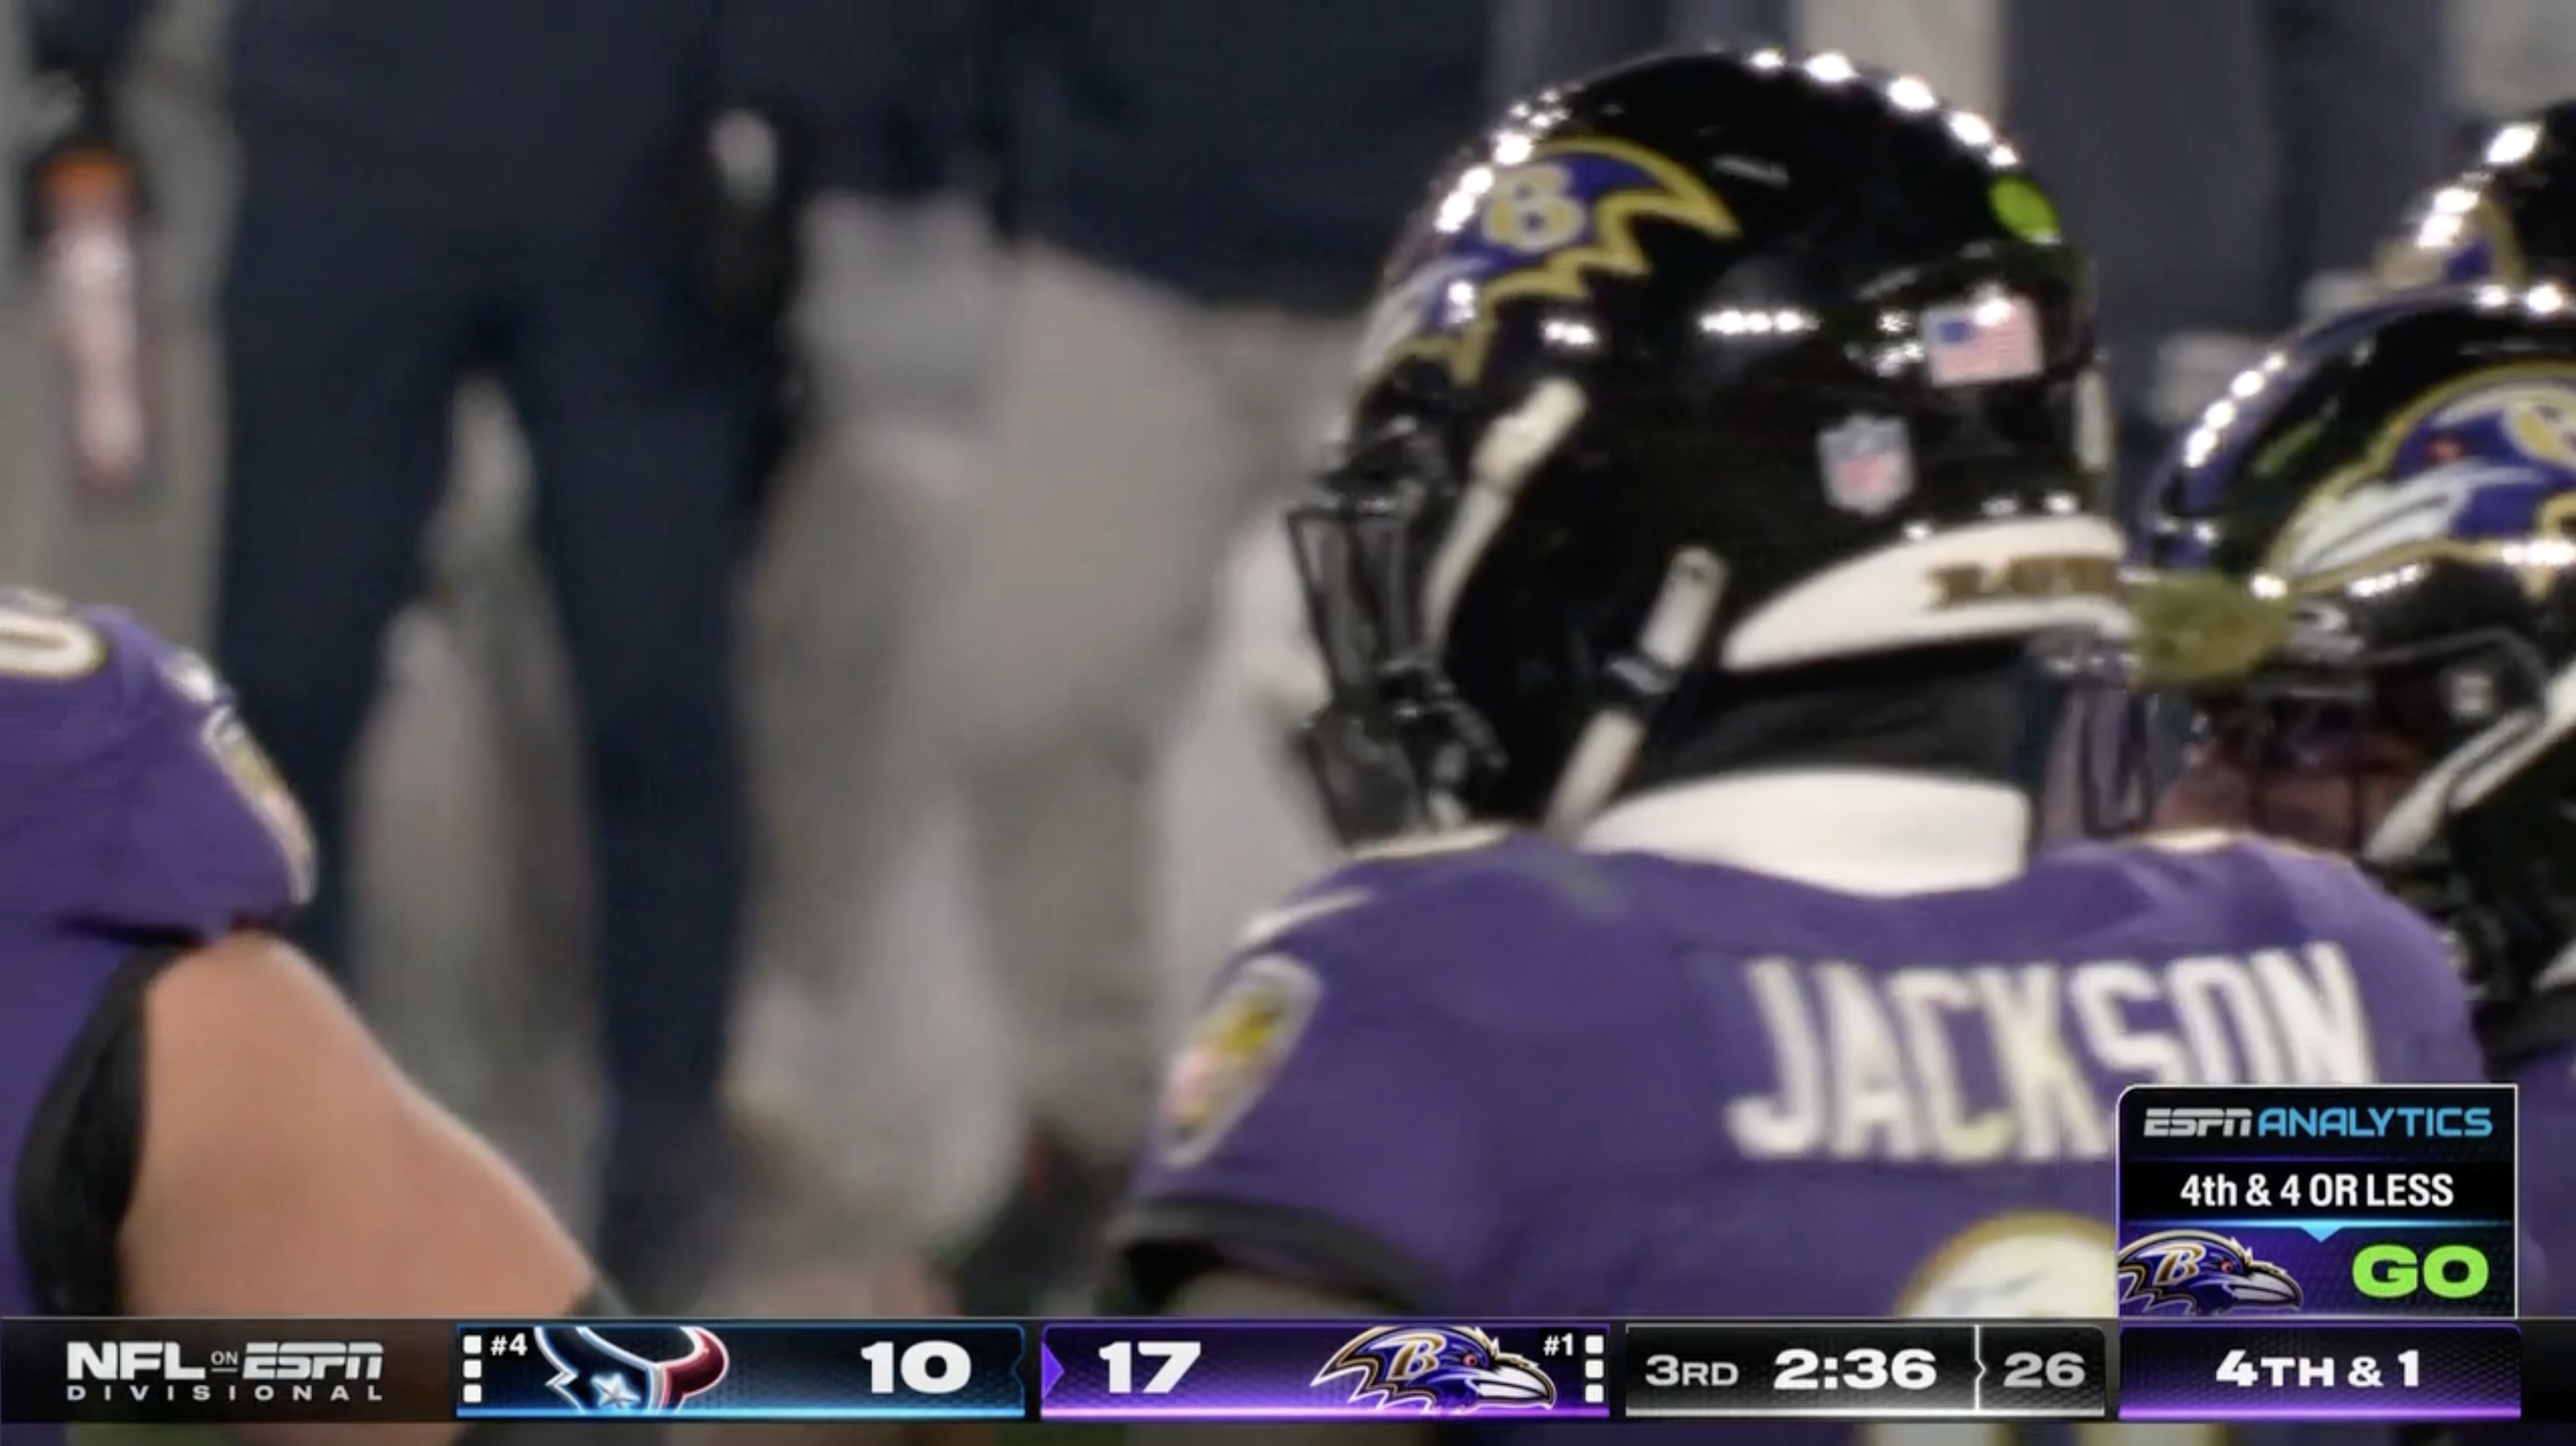
Late in the third quarter of the Ravens' divisional round matchup against the Texans, Baltimore, leading 17-10, faced a fourth-and-1 at the Houston 49-yard line. Then, in the bottom right corner of the ESPN broadcast, a graphic popped up giving an analytical perspective of coach John Harbaugh's decision on whether to go for it, punt or kick a field goal: "4th-and-4 or less: go."
As NFL broadcasts for multiple networks have incorporated more quantitative analysis into their coverage of game-management decisions in the moment, a question has been raised by some viewers: Do analytics models always recommend going for it?
In reality, though, it only seems like the models always suggest going for it on fourth down because the broadcasts only choose to display the graphics at times when the choice is interesting or controversial. For example, when it's fourth-and-10 at a team's own 25-yard-line in the first quarter, it's an easy decision to punt -- for both the coach and the models -- and there's no need to even show a graphic about the decision.
Because analytics models essentially all agree that coaches err on the conservative side on fourth downs when conventional wisdom suggests a decision might be close, the models usually believe it's worth going for it.

On some graphics, including ESPN's, the model also indicates how far back it would recommend going for it. For example, it might say, "4th-and-4 and in: go." By definition, there are distances to go where the model would not recommend going for it. (In ESPN's case, the graphic is indicating the clear go-for-it situations.)
The recommendations from ESPN's win probability model are available for every fourth down from the previous week at espnanalytics.com/decision. Looking at the Buccaneers-Lions divisional round matchup, for example, there were eight punts or field goals with which the model agreed. Here's what those graphics look like.
How does ESPN's model make its decisions? It incorporates the score of the game, distance to gain, yard line, clock, timeouts, pregame win probability and the relative strength of the offense and defense on the field. The number of permutations of potential fourth downs is incredibly large and can't fit into a single chart, but here is a useful cheat sheet based on typical situations:
One other frequently asked question that comes up about fourth-down models: "There's a 3 percentage-point difference between going for it and punting. Why get worked up over something so small?"
It's because 3 percentage points is not small for a decision. A 3 percentage-point change in win probability is roughly the equivalent to a first-quarter sack. That might not sound huge, but imagine if a coach was offered a choice between starting the game normally, or having his quarterback take a sack on the first play and start at second-and-17. No coach would choose the latter, right? That is the equivalent to blowing a medium-leverage fourth-down opportunity. In addition, a coach can make multiple fourth-down errors in the same game. When that occurs, the lost win probability stacks up and can become significant.
In all cases, we're measuring the decision and the point of making optimal decisions is to help a team win. Quantitative analysis plays a critical role in that.
