|
It is probably not news to most that the red zone is important. I'll spare you the clichés about it being the most valuable real estate in football and instead point out that we never hear about an organization adding an athletic receiver to serve as a "midfield specialist." You don't tune into the Field Position channel on Sundays. Teams don't succeed or fail solely upon what they do inside the 20-yard line, but it sure doesn't hurt when they dominate in the shadows of the end zone. As much as we know that the red zone matters, we don't necessarily have a great idea of who matters more often than not in that zone. There are vague archetypes -- big, athletic tight ends are good to have around -- but do you know which offense was best in the red zone last year? Or which defense did the best job limiting damage inside its own 20? Probably not. Let's change that and take a big-picture look at the red zone. Are there teams that consistently perform well with the end zone in sight? Is that a reliable, meaningful skill? Can teams bend without breaking? What does history tell us about how teams will perform inside -- and outside -- the red zone in 2016? Offenses in the red zoneFor the purposes of our analysis here, Football Outsiders does a great job of tracking how an offense performs in the red zone as part of their Drive Stats, which are compiled by Jim Armstrong. After stripping out the possessions which amount to Hail Mary attempts or kneel downs before a half, Armstrong calculates performance on a per-possession basis in a number of categories. One of those is the average number of points a team scores per trip to the red zone. Last season, the league's best red zone offense will be of little surprise: Carolina, which had a dominant power-rushing attack led by league MVP Cam Newton, averaged 5.54 points per red zone trip. The 32nd-ranked Browns, meanwhile, averaged 4.15 points per possession inside the 20. The Panthers were also an effective offense outside of the red zone, though, and the Browns were a mess in about every context imaginable, so those numbers aren't particularly surprising. That brings up an interesting question: are there offenses that consistently raise their game in the red zone and play better than their overall performance would suggest? Likewise, are there useful offenses which consistently bog down inside the 20 and settle for field goals? 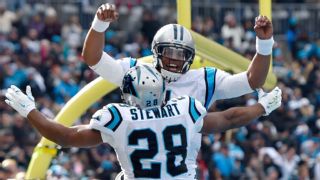 I used the Drive Stats to check this out. They go back to 1997, leaving 19 seasons of history to examine teams ranging from the 2003 Colts (who averaged a league-high 6.06 points per red zone trip) to the 2000 Cardinals (who somehow only managed to pick up 3.11 points per possession). For those offenses, I wanted to try and answer three questions: Is red zone performance consistent from year-to-year? Do teams that play better or worse in the red zone than we might expect in a given year keep that up the following year? If not, what happens to teams with a big gap between their overall performance and their red zone numbers?
Red zone performance plays a huge role in overall offensive performance. The correlation coefficient of the relationship between rank in points scored per red zone possession and rank in points scored per offensive possession is 0.65, suggesting that 42.8 percent of the variance between teams' offensive performance is defined by their respective performances in the red zone. That's not necessarily a surprise, but it's worth pointing out in light of the numbers to come. Football is a notoriously noisy sport, so it's no surprise that teams are inconsistent from year to year. The correlation coefficient in terms of rank in points scored per possession by teams from year to year is 0.46, which implies that 21 percent of a team's points scored in a given year can be explained by how they performed the previous year. Red zone performance is far more fickle. The correlation coefficient between a team's rank in points scored per red zone possession one year to the same stat the following year is just 0.24, meaning that just 6 percent of the difference from year to year is explainable by the previous season's performance. In other words, great overall offenses are far more likely to repeat success the following year than offenses which are strictly great in the red zone. The best red zone offenses in 2014 were unable to keep up the feat in 2015. That starts with one of the more bizarre outliers in league history: In 2014, the Raiders were 31st in points scored per possession, but on their infrequent trips into the red zone, they led the league in average points scored per trip inside the 20. While they still outperformed their overall rank last season, they were 20th in points per possession and 10th in points per red zone trip. The Broncos fell from second in points per red zone possession to 22nd. The injury-scarred Cowboys dropped from third to 27th. The Chargers and Eagles arrested the fall some, but even they were no higher than 16th. Meanwhile, after posting the league's worst red zone offense in 2014, the Jets improved to fourth this past year. This just isn't a consistent skill. You also won't be surprised to hear that teams can't reliably outperform their level of play, either. The Raiders are an extreme example, as they had a 30-gap difference between their rank in points scored per possession (31st) and points scored per red zone trip (first). The flip side of that would be the Giants, who were eighth in the league in points scored per possession and 31st in points per red zone trip. The Raiders were 30 spots better in the red zone in 2014; the Giants were 23 spots worse last season. Those gaps almost always disappear the following year. The correlation coefficient for that difference in rankings from year to year is just 0.14, accounting for 1.9 percent of the difference. There were three teams that underperformed in the red zone by a difference of 10 ranking spots or more last season -- the Giants, Bears, and Bills. Those teams historically have come in line the following year; the difference between their points scored per possession rank and points scored per red zone possession rank the subsequent year is just 1.6 spots. I suspected that these teams would improve their overall offensive performance the following year; if you figure that they were perhaps unlucky in the red zone, you might suspect that they would improve in that small sample sliver of the field and it would drive scoring up across the board. Instead, strangely, that isn't the case. These teams actually score less the following year, as their average rank in points scored per possession drops by 5.4 spots. Meanwhile, the teams that are better in the red zone than they were elsewhere improved by an average of 3.3 spots in the points scored-per-possession rankings the following year. Four teams fit that bill in 2015: the Raiders, Lions, Chargers, and Titans, with the Raiders and Lions (13th to 3rd) narrowly making it over the bar. Even if these teams aren't significantly better in the red zone again -- and history suggests that they won't be -- they seem to raise their broader offensive game and improve the following year. The only reliable way to be great in the red zone is to be great everywhere else, too. The data suggests red zone success often predicts greater overall success in the following season. 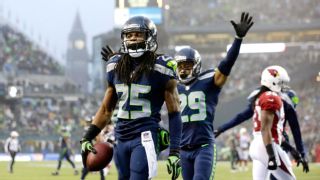 Defenses in the red zoneThe same is true for defenses, which appear to be even more random from year to year than offenses -- correlations across the board are lower. Just 30.8 percent of a team's points allowed rank can be explained by its rank in points allowed per red zone trip. And 7.4 percent of a team's points allowed rank is explained by its rank last year. The red zone year-on-year comparison accounts for just 2.4 percent of performance. It's almost entirely random. The poster boy for all of this would be the Legion of Boom in Seattle. The Seahawks have retained many of their stars on defense, but their red zone performance has oscillated wildly. In 2013, the Seahawks allowed the league's fewest points per possession and kept up their historic dominance inside the 20, allowing the fewest points per red zone trip. In 2014, they were second in points allowed per possession ... but fell all the way to 30th in points allowed per red zone trip, maintaining their high ranking in overall performance by keeping teams from reaching the red zone. And then last year, the Seahawks were consistent as can be, finishing fourth in both points allowed per possession and points allowed per red zone trip. There were three teams to "underperform" by a comfortable margin in the red zone last year. They were pretty successful without being dominant red zone forces, though. The Broncos had the league's best defense by points allowed per possession but were just 15th on red zone trips for a 14-rank gap, a difference they shared with the Chiefs. The only other team with a gap of 10 spots or more was in New England -- Bill Belichick's defense has often been described in the past as a bend-but-don't-break unit. The numbers here suggest that the idea of a consistent bend-but-don't-break defense is a myth, and indeed, previous research suggests that they weren't really that sort of defense in the past, either. The Pats were ninth in overall points per possession allowed and 20th on red zone trips. Those teams do typically get worse the following year; they decline by an average of 5.6 spots in terms of points allowed per possession. Teams that excel in the red zone, meanwhile, see an improvement. Four teams had a positive gap of 10 spots or more between their ranking in points allowed per red zone trip and their ranking in overall defensive scoring allowed per possession. Those teams improve their points per possession ranking by an average of 5.3 spots the following year. Strangely, the team atop that list on defense is the Giants, who were the polar opposites of their offense. Eli Manning and company were good around the field and terrible in the red zone. Steve Spagnuolo's defense was pretty bad in most spots and much better defending the goal line. It ranked 29th in points allowed per possession and 13th in points allowed per red zone trip. The Chargers also fit in this group, as do the teams which ranked second (Vikings) and third (Steelers) in red zone performance. They are defenses likely to improve some in 2016. 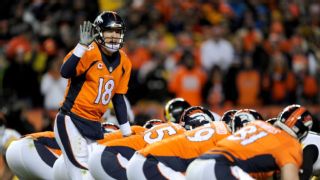 QuarterbacksGoing back to the beginning of the QBR era in 2006, a look at red zone numbers reveals video game statistics for many of the game's top quarterbacks. The typical qualified quarterback -- one who has thrown 300 passes or more in the red zone over that time span -- has thrown more than 10 touchdowns in the red zone for every pick. The best quarterback in the red zone over that timeframe? Depends on what you're looking for. If you want to just give your team a chance to score without making mistakes, look for Aaron Rodgers, who has thrown 164 touchdowns against just eight red zone interceptions on his 601 pass attempts, good for a touchdown-to-interception ratio of 20.5. The passer who completes the most passes, moving the ball forward in a dangerous space, is Drew Brees, who hits on 62.1 percent of his attempts. Brees has also thrown the most touchdown passes, with 226 touchdowns against just 19 picks. Tom Brady seemingly ranks second or third in just about every category. Above all, though, there's Peyton Manning. Over that 10-season timeframe, nobody posted a higher Total QBR (82.7) or passer rating (103.3) in the red zone than him. In addition to crazy traditional numbers -- Manning's thrown 203 touchdowns against just 10 picks -- he was more efficient than any other passer in the tight spaces of the red zone. Teams couldn't sack him, with Manning going down on a league-low 1.8 percent of dropbacks in that area of the field. Ben Roethlisberger, for comparison, takes sacks on 7.4 percent of his red zone dropbacks. With Manning getting so many passes off, 27.5 percent of his pass attempts resulted in touchdowns. That, too, led the league. Brees, Rodgers or Brady inherit the throne with Manning's retirement, but the two-time Super Bowl champion was an absolute monster in the red zone. Pass-catchersLet's finish up by seeing which receivers dominate the most in the red zone, again going back through 2006. There's a variety of ways to gauge receiver impact, but one simple, understandable way is to track how frequently receivers turned their routes into touchdowns. ESPN Stats & Information tracks route frequencies, so we can see how often players were targeted and what they were able to do with those targets. Cutting down the list to players who have 200 or more red zone targets in that span or more, we get a lineup that would jibe with our perceptions of who might succeed and fail in the red zone. The guys at the bottom of the list are mostly undersized, speed-first wideouts: guys such as Devery Henderson, Harry Douglas, Devin Hester and DeSean Jackson, who has to be one of the best wide receivers in league history to never post a season with 10 or more receiving touchdowns. At the top of the list? I'll give you one guess. That's a group mostly consisting of big, physical receivers capable of winning at the line of scrimmage and creating separation to bring in tight throws. Marshall might have better numbers, of course, if he had better quarterbacks. And Owens' numbers are deflated by his propensity for drops -- T.O. dropped nearly 10 percent of the passes thrown in his direction. Compare that to Greg Olsen, meanwhile: the former Bears and current Panthers tight end hasn't dropped a single one of the 131 passes thrown to him in the red zone as a pro. Jason Witten, too, has a (positive) 0-fer on 157 tries. You probably came into this thinking Rob Gronkowski was the best red zone receiver in football, and a couple thousand words later, you have it confirmed. I'll throw something else out there as a nugget to close things up, as there might be a contender to Gronk's throne. Last year, Gronkowski only managed to turn 10.1 percent of his routes into touchdowns, which was ninth in the league. The Jets combo of Brandon Marshall (12.0 percent, fourth) and Eric Decker (15.6 percent, second) both came in ahead of Gronk. No. 1, though? That would be Washington's Jordan Reed, who produced touchdowns on a staggering 18.2 percent of the routes he ran in the red zone last year. He can't keep that up, but can he be the closest thing to Gronk the NFC has seen since Jimmy Graham? That's one of the many stories worth monitoring when the regular season -- and the red zone -- finally opens for business in September.
|