|
On July 5, 2015, ICC's new ODI rules kicked in. The changes were largely to brought in to offer some succor to the bowlers, who, in the words of Dave Richardson, the ICC chief executive, had been on a "hiding to nothing" with the earlier rules, which allowed only four fielders outside the circle in the last ten, and also had a batting Powerplay which was usually taken between the 36th and the 40th. Under the new rules, the batting Powerplay was done away with, while an extra fielder was allowed outside the circle in the last ten. Also, there was no compulsion to have two catching fielders within the first ten. Since those rules kicked in, 113 ODIs have been played, which is a reasonable number to check whether those new rules have had the desired effect on the scoring rates and helped bowlers a little bit. The most recent evidence would suggest not, given that England made the highest ODI total a couple of days back at Trent Bridge against Pakistan, but a longer term view suggests little difference in the overall numbers. In its latest avatar, the average ODI has witnessed a run rate of 5.33, which is almost exactly the same as the rate when the earlier rules were in force between October 30, 2012 and July 4, 2015. The scoring rate increased dramatically in the first six months of 2015, rising to 5.67 from 5.29 in 2014. Those six months included the 2015 World Cup, where the scoring rate was 5.65, and the New Zealand tour to England, where the rate across five matches was an astronomical 7.15. Between October 30, 2012 and December 2014, the overall run rate was only 5.25. When splitting the numbers by teams batting first and second, the distribution is very even over the last 14 months. The teams batting first and chasing have won exactly 54 games each, while the run rates aren't very different either. The numbers are quite similar to those between January 2014 and July 4, 2015. The bigger difference, as expected, has been in the last 15 overs. With teams usually opting for the batting Powerplay between the 36th and the 40th, and only four fielders allowed outside the circle in the last ten, the last 15 overs had earlier given the batting teams the licence to hit out freely, knowing that there was minimal risk of being caught at the boundary. However, with the batting Powerplay being scrapped and an extra fielder allowed on the boundary in the last ten, the run rates and the boundary-hitting frequency has dropped significantly. Since July 2015, the run rate for teams batting first in the last 15 overs has dropped to 6.95 from 7.81 in the earlier period. The balls per boundary has gone up from 6.7 to 8.7, a change of nearly 30%. With more fielders on the boundary, batsmen have had a few more opportunities to take twos, but overall the run rates and boundaries have reduced in the slog overs and bowlers have had more opportunities to have some control on the game. The difference in the second innings isn't so significant, though. With a specific target to chase, teams weren't so aggressive in the last 15 even when the field restrictions were in place. The earlier fielding restrictions were tough on bowlers when opposition teams had wickets in hand. When teams batting first had gone into the last ten overs with five or more wickets in hand, they scored at 9.62 per over and averaged 56.81 runs per dismissal. In the last 14 months, those numbers have dropped to 8.78 and 43.58. In the first 35, the rate has gone up marginally - from 4.72 to 4.83 - but it is in the last 15 that bowling captains will feel they have more protection and a better chance to somewhat control proceedings, thanks to the extra fielder available in the outfield. When England go the way they did at Trent Bridge, though, even that extra fielder makes absolutely no difference. **** England's resurgence in ODIs over the last year has been written about before in much detail, but they have been so good recently that it deserves another mention. The 444 at Trent Bridge further underscores their transformation from the team that was such a dismal failure in the 2015 World Cup. Since that tournament, they have scored 350 or more six times in 28 innings (including two washouts), and have six other scores between 300 and 349. In 644 previous ODIs, they only had only two scores in excess of 350.  A comparison between their numbers over the last year, and those between January 2014 and March 2015, shows outstanding improvements in all aspects, but especially in terms of power-hitting. In the period between January 2014 and March 2015, England scored a boundary (four or a six) every 12 balls and scored 40% of their runs in boundaries. They averaged 75 balls per six, which works out to four per 50 overs. Since the World Cup debacle, the batting line-up has transformed, and so has the boundary-hitting ability. Their balls per boundary has dropped to eight, percentage of runs in boundaries has risen to 49, and the balls per six has dropped to 46. All of those factors have contributed towards a run rate of 6.39, and a win-loss of 16-9, from a miserable 13-23 in the earlier period. With the batting firepower that they command at the moment, they would have to be favourites for the Champions Trophy that they will be hosting next year. 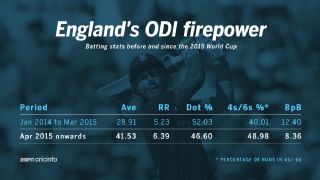
* Percentage of total runs in boundaries
^ Balls per boundary (4 or 6)
|