
Earlier today, Florida State head coach Jimbo Fisher discussed how voters should judge the Seminoles’ blowout of North Carolina State last Saturday.
In the 49-17 win, Fisher sat his starters for nearly all of the second half after Florida State ran up a 42-0 halftime lead. Asked after the game if he'd missed a chance to earn some style points in the eyes of voters, Fisher said he refused to coach based on the polls.
Highest Avg Win Probability
In-Game, FBS Since 2004
"I'm not going to go out there and embarrass this game and the integrity of how you've got to play," Fisher said. "If that's the way they're going to do it, they need to reevaluate. If they can't tell we dominated that game early and put it away -- I just think that's bad for college football, in my opinion."
Fisher has a point. Florida State scored touchdowns on its first five possessions and was up 35-0 just 13 minutes into the game, never looking back on the way to an easy victory.
Though the Seminoles were technically outscored 17-7 in the second half, at no point was victory even remotely threatened. Would running up the score to earn “style points” and impress voters really have said anything more about Fisher’s team than the dominating first half already did?
This is where using the final score to evaluate a team’s performance can break down. As anyone can tell you from watching games, not all seven-point wins are created equally. In the case of Florida State against NC State, a 32-point blowout actually understates how dominant the Seminoles were in the game.
A better way to look a team’s dominance or control over an opponent is to look at how their chances to win evolve throughout the game.
Based on play-by-play data from FBS games going back to 2004, ESPN Stats & Information has a win probability model that can do exactly that: take into account the situational factors (time, score, field position, down, distance, etc.) and determine the percentage chance each team has of winning the game at that point.
As the touchdowns piled up early on, Florida State’s chance of winning quickly rose to 80 percent, then 90 percent, then 95 percent, and never really dropped from there. The graph of their average win probability on each play in the game shows just how quickly it got out of hand.
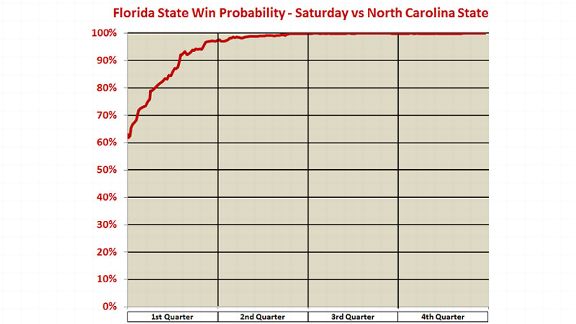
Florida State’s average win probability for that game was 94.9 percent, meaning that on an average play in that game, the Seminoles had about a 95 percent chance of winning. That value is not only the highest average win probability by any team in any game this year, but the second-highest in the more than 7,500 FBS games play-by-play data exists for over the past 10 years.
While the final score wasn’t indicative of one of the biggest blowouts of the year, watching the progression of the game in Tallahassee shows that Florida State “dominated that game early and put it away" about as much as any team has in any game.
In the near future, ESPN Stats & Information will be releasing a team rating system that goes beyond wins and losses to judge teams’ résumés. But it does not explicitly incorporate the final score, instead using this measure of average in-game win probability as a more thorough way to judge how well a team performed on every play in every game.
With the emphasis on how a team approaches winning or losing on every single play, there’s very little incentive to run up the score when the game is already in hand.
So Coach Fisher can rest easy knowing that he won’t have to worry about extra style points to get his team its due for a truly dominant performance like last Saturday.